Managing a larger number of inventory items by maintaining ideal stock levels and accurate counts is a daunting task. The challenge is exacerbated if the quantity of items is large and varied.
The sales level classification feature described within this section is useful only for inventory classified as Track Count.
The Sales Level Classification option within EBMS groups perpetual inventory items into smaller, more manageable groups. This option is included in the optional Advanced Inventory module. Sales level groups are determined by the Sales Level Classification table entered within the as shown below. (If the Advanced Inventory module is not installed, this tab will not appear.)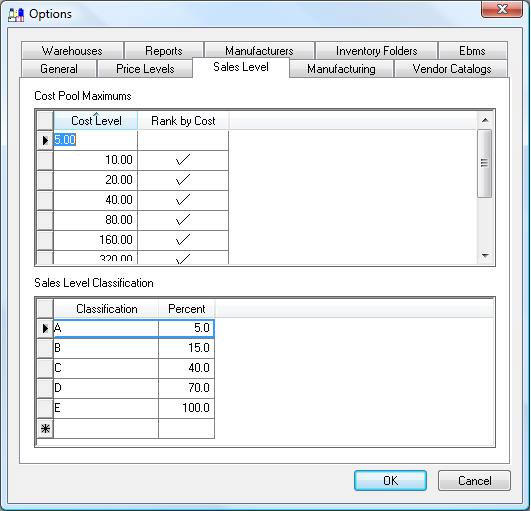
The Sales Level Classification list identifies the percentage of inventory items that are classified in each group. In the example shown above, the top-selling 5% of inventory items will be grouped in Classification A. The next 10% (those between 5% and 15%) will be classified in Group B, the next 25% (between 15% and 40%) of the inventory items are classified in Group C, etc. The number of Classification groups and the Percent values can be created or changed based on the user's needs. The focus is often placed on managing the inventory levels on the best-selling items. Because of this focus, the first few classifications normally contain a smaller percentage of the total inventory items compared to the more average groups.
Determining which items are the top 5 percent (the items in Classification A) is a complicated process. The following examples highlight some of the potential pitfalls of using a simple formula to create the Sales Level Classification group:
Example 1: Simple formula based on the quantity of items sold. Imagine a company that sells a wide variety of items, including some popular items that cost less than a dollar. If the system would classify items based only on sales quantity (assuming the sales total of these inexpensive items are higher than any other items), the grouping would contain only the low-cost items. Although these items should be part of the focus, these items should not be the sole items within the Classification A group.
Example 2: Simple formula based on the cost value of the items. On the other extreme, let's imagine a company sells a few items that are very expensive compared to the bulk of their inventory items. If the system would classify inventory items solely based on the value of the sale, these expensive items, although they should be in the lower classifications, will appear in the higher in the list. The items with a value that is drastically less will fall in the lower classifications based on the total value.
Most companies want the inventory products grouped in a balanced manner, including a wide variety of values. This is accomplished within EBMS using a Cost Pool Maximums table. The Cost Level column breaks inventory items into different cost levels based on the value of the inventory item.
The Cost Pool Maximums table ensures that inventory items that fall within any of the cost value ranges will be included within each Sales Level Classification. For example, using the Cost Pool Maximum and the Sales Level Classification table shown above, 5% of the items that cost up to $5 will be included in the Group A classification, 5% of the items costing between $5 and $10 are included Group A, 5% of the items with a cost in the $10 to $20 range are included, 5% of the items between $20 and $40, etc. This method ensures that the Group A classification is not skewed towards items with extreme costs.
Less than 10% of the products within the inventory system should have a value in the range shown on the first and last lines of the Cost Pool Maximum table. For example, if few of the inventory items sold have a cost value of less than $5 than enter a value of $5 in the first record. This value should be lowered if a significant number (greater than a few percent) of items have a value less than $5. The second record ($10 in the example shown above) should be twice the value of the first record. Repeat this process until a value is reached that includes the cost of most of the products (less than a few percent of items) within the inventory system. Add a final line to the table to include all items that are above the last value ($640 in the example). The EBMS software recommends the exponential calculations described in this paragraph, but they are not required.
The Rank by Cost option within the Cost Pool Maximum table is used to solve the simple formula problem described earlier in this section. This setting has two options:
-
Disabled (unchecked): Rankings are determined by using a formula based on the quantity of items sold.
-
Enabled (checked): Rankings are determined based on the cost value of the individual items.
The recommended setting is to enable the Rank by Cost column for every record except the first and the last. The following paragraph will explain the reasoning for this recommendation:
Since the cost within the first range of items in our example can cost between a penny and $5, ranking items based on the cost value may not group this range of products properly for the same reason as explained in the simple formula example. 1,000 items sold for a cost of one cent would rank lower than 3 items with a cost value of $4.99 each. To solve this problem, the Rank by Cost option is disabled to cause the grouping to be measured by the quantity sold rather than the cost value. The $4.99 item will not rank much lower than the penny items.
The same issue may arise for items in the last Cost Pool Maximum range (in the example above, these are items with a cost value of over $640). An item with a cost value of $100,000 that was sold only once would rate higher than 100 items with a value of $900 each. For this reason, the Rank by Cost option within the last Cost Pool Maximum tab should be disabled.
Running the Utility
A process must be run to update the Sales Classification setting within the product record Purchasing tab. Go to Inventory > Utilities and launch the Determine Sales Level utility. The following dialog will open. (Note: If the Advanced Inventory module is not installed, this utilities option will not appear.)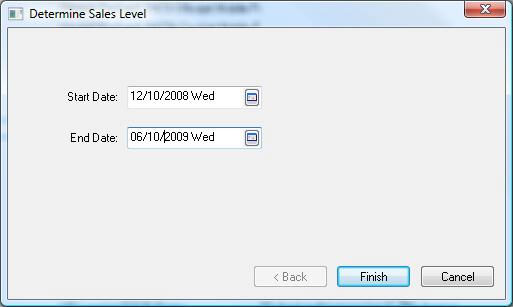
Enter a range of sales dates to determine the sales level. The utility reviews all the sales invoice detail lines that fall within the given date range. The greater the range dates, the more history is available to analyze. (If the company contains many seasonal items, it is best practice to have the date range cover at least a year.)
Click Finish to update the Sales Classification.
Go to the product record Purchasing tab to view the Sales Classification setting as shown below: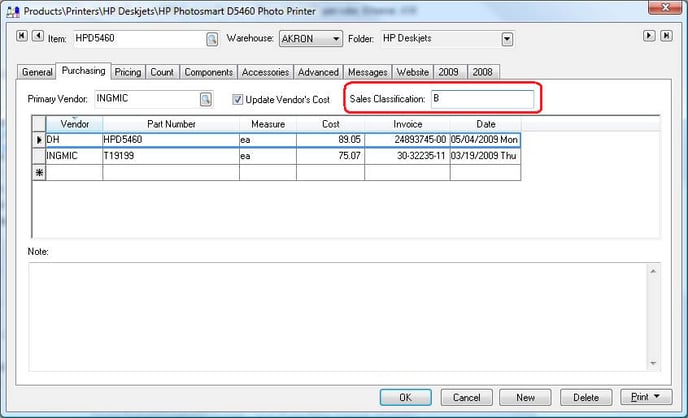
The Sales Level Classification allows the user to sort the items within the purchasing screen by classification.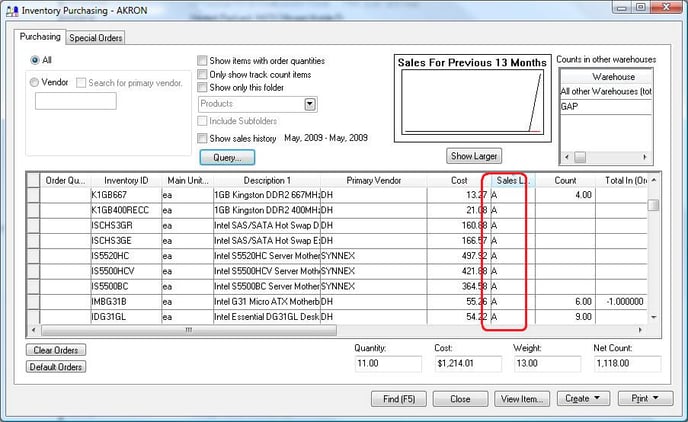
The Sales Level Classification process is a feature of the optional Advanced Inventory module, which may or may not be installed in your version of EBMS. Contact your Koble Systems account manager to add a new module or feature to your EBMS subscription.