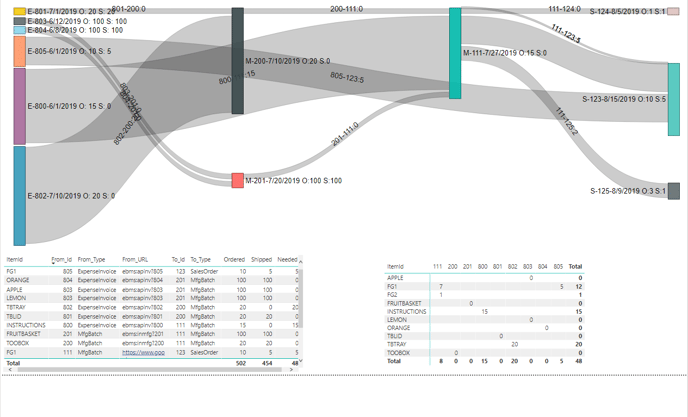
A visual Power BI chart is an effective way to display a snapshot of the multiple step manufacturing process from raw materials to sales orders and purchase requests.
The Sankey diagram links and visualizes the following EBMS documents:
- E: Purchase orders or expense invoices that contain raw materials or parts used to manufacture sub-assemblies or finished goods.
- M: Manufacturing batches. (The following example contains multiple level batches.)
- S: Sales orders that contain the finished goods.
Requirements
A Sankey diagram business intelligence report requires SQL Mirror and a business intelligence tool to create a Sankey Diagram. Review SQL Mirror and Power BI Overview for details on these advanced EBMS tool options.