

For the team at e-Bikes of Holmes County, EBMS (Koble's ERP Platform) has long been the backbone of their operations. It holds everything they need to know about inventory, sales, customers, and more. But pulling all that data together in a way that made sense—especially when it came time to make buying or marketing decisions—could be time-consuming.
That’s where Koble Analytics came in.
“In the past, we’d try exporting different spreadsheets, breaking down those spreadsheets to compare them, but nothing worked like Koble Analytics does,” one team member explained. “We’ve been looking for something like this for I don’t know how long, to be honest.”
Reevaluating Inventory
Koble Analytics gave the e-Bikes team an easier, faster way to see what was happening across the business. Instead of pulling one-off reports, waiting until the end of the month, or skipping reports altogether, their team now checks their dashboards every day. Koble Analytics works hand-in-hand with EBMS to pull up-to-date business data.
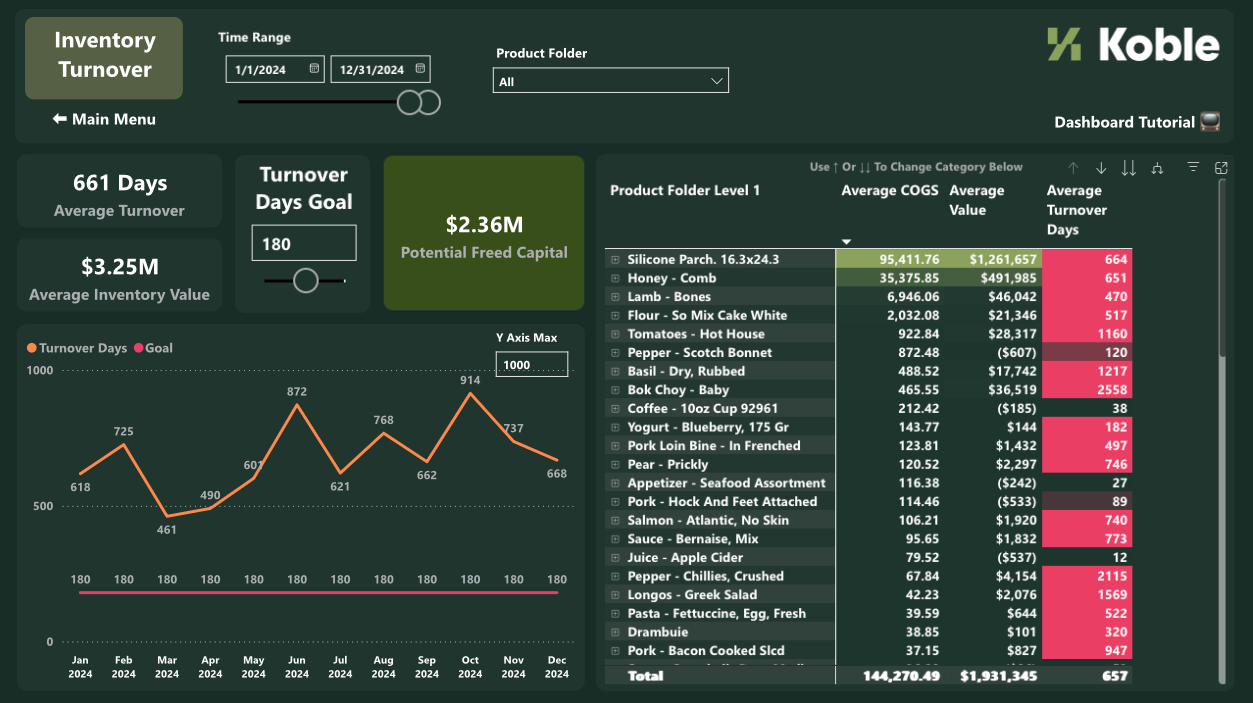
One of the dashboards they rely on most is the inventory forecasting dashboard. With it, they can break down inventory across categories—bikes, accessories, components—and quickly see what’s selling and what’s slowing down. That clarity has helped them adjust their purchasing more confidently and more often, freeing up cash flow that would’ve otherwise been tied up in overstock.
“One of the biggest shocks was what I learned about our overstock value. For example, I’m way overstocked right now on our most popular brake pad. We’ve got 209 days of inventory for that item. Our goal is 60. That alone is a significant amount in overstock tying up cash in this one component,” said Allen, e-Bikes’ Inventory Manager.
“It was eye-opening to learn the size increments that we needed to order things in—it’s less than I would have thought. And the dashboard breaks it down to where I don’t need to be looking at a calculator trying to figure out orders for each and every part and component.”
The inventory forecasting dashboard has made such a difference for Allen in the 6 weeks he’s had access to it that his day-to-day now looks entirely different than before they had Koble Analytics. He’s been able to save 20 hours of work a week by referencing the dashboard instead of building spreadsheets. It’s helped him clarify purchasing decisions with the goal of refining and lowering their stock levels.
[Try out this interactive demo of the dashboard!]
Reevaluating Sales and Marketing
Allen has been eBikes’ Analytics power user, but while he’s fine-tuning their stock levels, David, Owner of eBikes, also started using the sales dashboards to guide their marketing efforts. The customer location dashboard, for example, showed where their customer base was strongest—information they already had in EBMS, but couldn’t easily visualize. Now, that data helps them decide where to focus regional marketing spend and where to grow.
“I like the customer map that shows where our customers are coming from. It helps me better understand where to target, which areas our marketing is working and which areas are not. It’s been a good validation on some of our current marketing efforts.”
David also uses the sales dashboards to closely monitor daily sales. Instead of running reports and manually going through different G/L codes, he’s got up-to-date visual dashboards showing him what’s happening.
“It’s going to help us recognize any potential declines more quickly so we can take action. Before, it was kind of easy for a decline to happen without us really realizing it.”
[Try out this interactive demo of the dashboard!]
As the business continues to grow, they’re adding more dashboards and uncovering new ways to use the data they already have. EBMS gives the team the structure and accuracy they need, while Koble Analytics makes the data easier to interpret, share, and act on.
--
Could a new look at data help revolutionize the way you do business? Contact us for a Koble analytics demo to see how our dashboards could help you discover new perspectives into your inventory, customer base, financials, and more.

Melanie Hess is a content writer at Koble. She loves diving into relevant business topics and sharing what she learns through writing articles, blog posts, and more. When she's not learning about ERP implementation, business financials, or inventory management, she likes long walks, podcasts, and trivia competitions.