It used to be that you couldn't get enough data to make informed decisions for your business. So you built out an ERP system and brought your business data together into one database.
Now, you again struggle to make data-driven decisions, but this time it's not the lack of data that is the issue, it's the data overload.
You need answers to increasingly specific questions so that you can better forecast for the future, delegate current work, and maintain consistency across the organization. How are your salespeople performing over time? How much inventory do you need to purchase every month? How quickly are your vendors fulfilling your orders?
You know the answers are there, but you don't have the time or the manpower to map the data to those questions.
That's where Business intelligence comes in. It can take that tsunami of data and sort it into manageable rivers and streams. This way, you can find the answers you need to make the best decisions to move your business forward.
What is Business Intelligence?
Business Intelligence (BI) technically refers to insight into your business, but colloquially refers to the tools that dig into your data and sort the information you need from the information you don't. There are a host of BI tools, from the more recognised Excel sheets to the powerful BI tools like Microsoft Power BI or Tableau.
How does it work?
First you need a question that you want answered, and data.
The BI tool then pulls from the columns of data to make calculations based on that data, or to sort it or group that information in a way that is intended to answer that specific question.
Unlike Excel sheets that require you to go in and make additional calculations or add in data, with a more powerful BI tool you can build a model that will do that for you, as it is built to take consistent input and continuously refresh the output.
And unlike standard reports, it does not assume how you will use the data, but rather gives you agency over your data so you can answer specific-to-your-business questions when you need to.
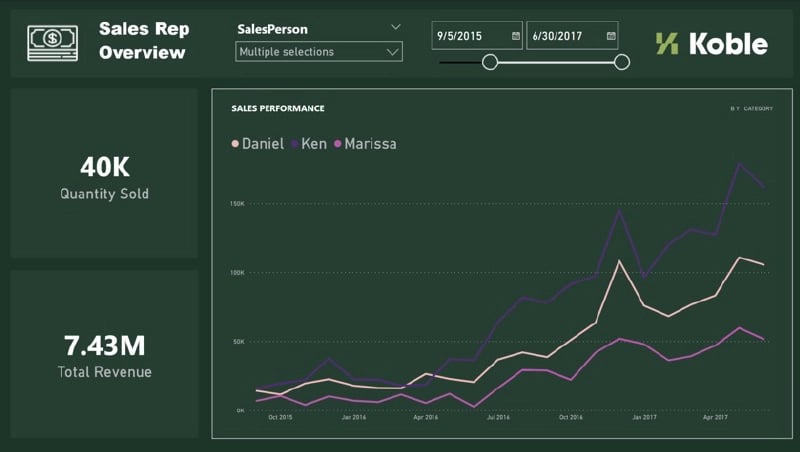
Take the question "How are my salespeople performing over time?"
In order to answer this question without more powerful business intelligence tools, you would have to build and excel spreadsheet (either from scratch or to modify a standard report that only captures some of the data) and then manually update it on a regular basis. With BI tools you can automate that report to your specifications and display the information in a visual dashboard that is easy to understand at a glance.
Every time you log into your dashboard the information would be up to date, and you could even drill down into the data you have for each sales rep to gain insight into individual performance. This helps you discover the data behind the data so you can answer any questions about the specifics that build the report. Overall, your data becomes much more accessible, making it easier to leverage it for your business needs and to take informed action.

Benefits of Business Intelligence
Advanced business intelligence tools can set you up for stronger decision making, so you can take action to build a more effective and cohesive team, a continuously improving customer experience, and happier stakeholders.
That's a lofty promise - so let's get into how BI can deliver.
- Stronger decision making
Specific knowledge of your business brings a level of predictability that allows you to face the uncertainty of the future with confidence. While you can't necessarily predict the economy or the supply chain or the weather, there are things you can predict.
If you know how your sales team has done year over year and how much each rep typically brings in, you should be able to predict if you should hire more reps. You can better predict which product lines you should invest more in if you know the profit margin of each item that you sell and which items are in high demand. With business intelligence, the specific questions that act as key indicators and metrics of success become answerable. And, by removing opportunity for human error, those answers become not only more accessible, but more reliable. Your decisions can be based off data you trust. - A more effective and proactive team
As your team grows, you are less and less in the weeds. At least, that is how it is supposed to work. Unfortunately, a lack of visibility into what is happening across the organization can encourage you to become the thing everyone warns against - a micromanager. Or you become so hands off that when things start going wrong, you don't really know where to start to fix it.
You want a team that is accountable and able to proactively find areas of improvement (before they become crippling) so they can keep developing well and moving forward. Business intelligence can give you the insight you need to keep teams accountable and base that accountability on real data instead of simply intuition.
For example, let's say you have multiple departments. One department seems slower than the others, but you're struggling to find the specific issue and therefor can't communicate it effectively to that department. With business intelligence tools, you can build a dashboard that allows you to track sales orders for the different departments and determine which parts of the company are holding up the products being invoiced. You can identify specific points of failure, allowing you to define the issue and communicate that to your team.
Business intelligence tools also empower you and your team members to get the information you need without having to ask a different department, reducing inefficiency and empowering you and your team to identify issues proactively. The more your team is equipped to do that themselves, the more you are freed up to focus on leading your business.
Business intelligence software can also be used to keep your organisation as a whole accountable in record keeping. Sometimes when a business brings on a more advanced BI tool, the first things they discover is that their data is a mess. Though it may not feel like it, this is actually a good thing! It can help you make the decision to either spend the time to correct the data or, more likely, build the practices going forward that will result in a better tomorrow with real checks and balances.
As you correct or strengthen these practices, you'll be better equipped to make decisions that will build a strong and sustainable business. - A better customer experience
It is crucial to build trust with customers by doing what you say you will do and keeping them informed. This becomes challenging with all the moving pieces in a growing business, but with specific and reliable insights into what is happening within your business - whether it be your labor breakdown by day, how fast your vendors fulfil orders, the seasonality of your workload, and so much more - you can set informed expectations for customers and consistently deliver on those promises.
As you track down these answers, business intelligence saves you time by making the process much easier and faster (and more reliable), allowing you to spend more time on customer success. In addition, you also save the customer time because they don't have to wait as long to get the answers they need. Whether it be where their order is in the process, or when you will be able to service their equipment, you are better equipped to keep customers informed. - Happier stakeholders
If yours is the type of business with multiple owners, a board, or other stakeholders who need to be confident that the business is doing well, business intelligence tools can help you present the answers they want in a clear and compelling way.
It can be used to demonstrate performance with exact numbers; no more guessing. and if stakeholders have questions about the specific data that was used to build that chart, business intelligence gives you the tools to drill down into any specifics of that dataset. Your stakeholders can be confident that data is reliable and feel confident that you know what is happening in the business.
How can you integrate business intelligence with your ERP?
If you want to effectively bring these two tools together, it is important to identify the goals of the project. Which questions do you want to answer? Which data sources are you going to use? Who is the audience you need this information for?
Once you have a good handle on that, it is time to choose the business intelligence tool. Typically your ERP provider will have a BI tool they primarily use. Koble, for example, primarily uses Microsoft Power BI, a leading BI tool which connects with almost any database system available, from SQL to oData to API, etc.
For more insight into the different business intelligence tools available, go here: https://www.techradar.com/best/best-bi-tools
Best Practices
As with any tool there are great ways to use it, and poor ways to use it. Here are a few key things to keep in mind as you put these tools to work:
- Invest in training
Often people approach advanced business intelligence tools with the mentality that it is "just like Excel" and they'll figure it out as they go along. However, BI tools like Power BI are more powerful than Excel. If you want to get the most out of it, we recommend putting in some work up front to learn how to use it well. There are courses online (like on Udemy or Youtube) that can help you learn the tool quickly. Setting aside time at the beginning to learn your BI tool will pay back dividends in time save down the road and in the results you can achieve, and the insight you'll gain into your business will be more than worth it.
If you don't have time to invest in training for yourself or someone on your team, we'd highly recommend working with a professional to build our the BI capabilities. Some ERP companies, like ours, also provide consulting services to help you better understand what tools like Power BI can do for you, and help you craft dashboards and reports that fit your business needs. - Clearly scope the goal of the question you are asking
It can be easy to get lost in the power of business intelligence. Soon you can have so many dashboards and reports that you are back where you started - facing a tsunami of data that threatens to overwhelm you.
Business intelligence can make splitting hairs fun, but it is important to ask yourself at what point does the answer stop impacting your decision.
It is important to be intentional when you build a dashboard, and to do regular audits to make sure the dashboard is still needed and still serving its purpose. Otherwise, you end up with a mess of reports and more confusion that answers. - Build out reports with the audience in mind
It is crucial that the data and how you display it answers the questions important to your stakeholders. The best way to ensure that happens is to talk to your end audience before you craft the reports. What information do they need and what kind of visuals will help them understand it at a glance? If they are involved in the process itself, you will have a much higher engagement with those reports. - Approach your visuals strategically
Business intelligence should make data easier to digest, which means visuals should be simple and tell a clear story.
The type of visual you use - bar chart, heat map, pie charts, etc. - should well-reflect the goal of the data. For example, you'd probably want to avoid using a pie chart to indicate the sales performance of 20 different products over specific periods of time. The numerous slices in the pie would be challenging to differentiate, and it would be hard to make accurate comparisons between the products.
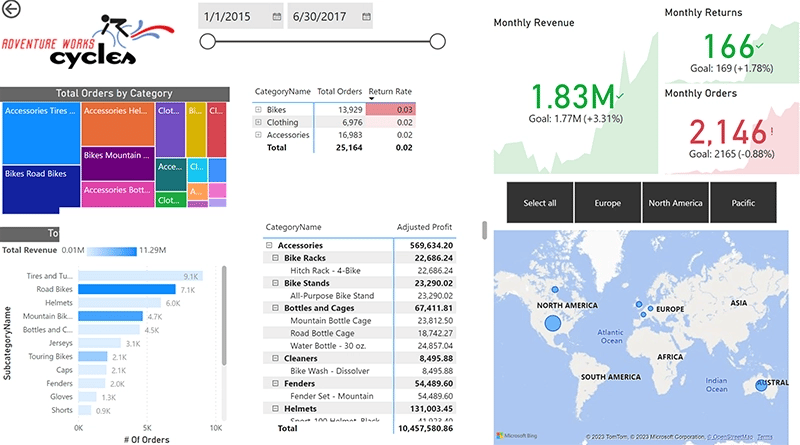
It can be tempting to get fancy with visuals or to overthink it as you try to incorporate every possible angle on the data (like the example below). A good rule of thumb is if your audience doesn't get the gist of the dashboard in roughly 10 seconds, you should simplify.
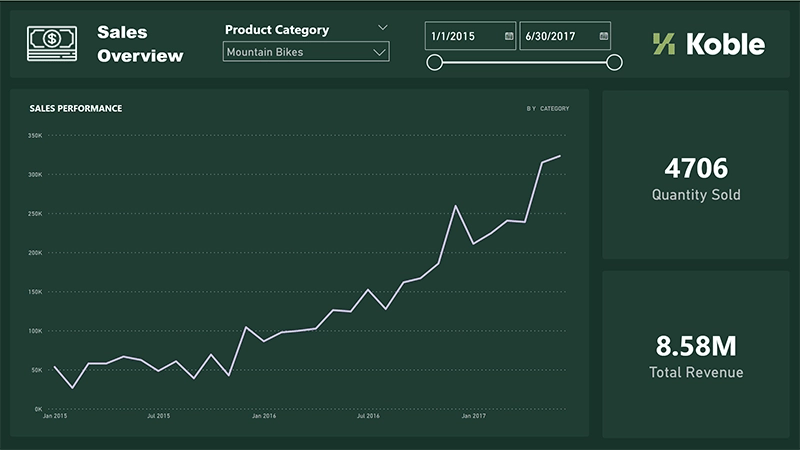
However, a simple chart like the one below that answers a clear question (in this case, how are sales of a specific product doing over time?) quickly conveys the point of the data, and can better inform any discussions around mountain bike production or sales goals.
It is also a good habit to keep consistent design elements - colours, fonts, styles - in place, so that your audience is better equipped to quickly understand the point. We've found the design principles listed here to be a helpful guide as we've built out different dashboards.
https://www.linkedin.com/pulse/dashboard-design-principles-best-practices-gustavo-cortez-msba/
Too long; Didn't Read
As your business grows and as you hire more people, every decision you make has a bigger impact. Vast amounts of data flowing in your business become increasingly difficult to manage with just Excel sheets or standard reports.
With advanced business intelligence tools, that tsunami of data becomes manageable and you gain access to the specific data you need without having to manually sift through all the data you don't. It makes it possible for you to answer specific-to-your-business questions quickly, and frequently, setting you up to take the right action step to move your business forward.
The next question you'll be asking yourself is where you should plan your next vacation with all the time you get back!
To learn more about EBMS and Power BI, reach out to your Account Manager.

Kelsey Stout is the Head of HR & Marketing at Koble. She loves helping people build strong and lasting businesses with meaningful work, the right systems in place, and a strong approach to culture. When not telling Koble stories, Kelsey can be found writing children's fiction, spending time with family, or playing the guitar (poorly but enthusiastically).


